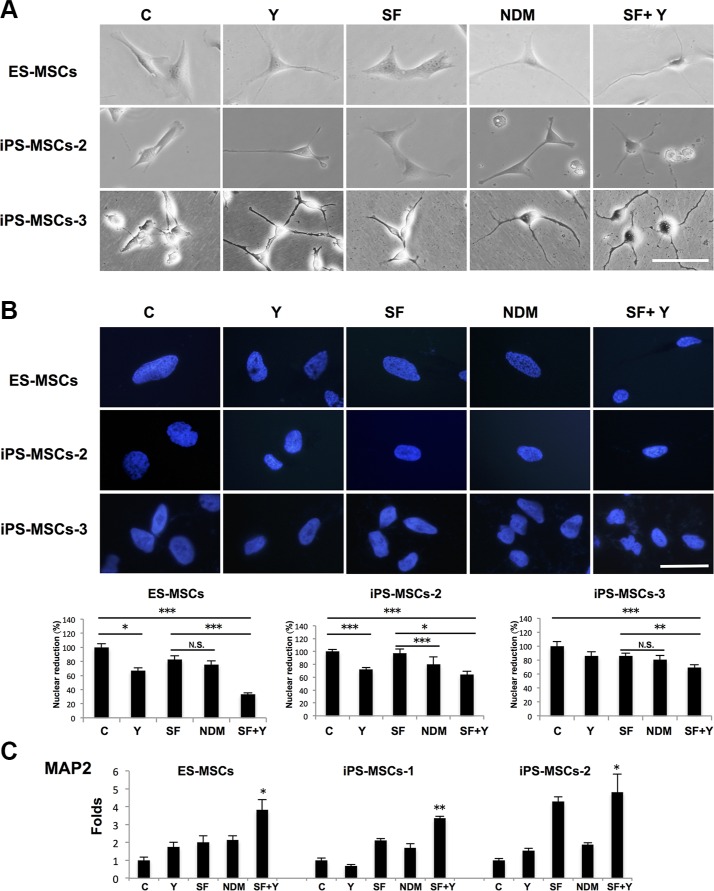
Figure 3. ROCK inhibition in serum-free (SF) conditions induce further neural lineage commitment of PSC-MSCs.
(A) Phase-contrast microscopy of PSC-MSC cell morphology after ROCK inhibition with Y-27632 in complete medium (Y), NDM, and Y-27632 in serum-free medium (SF+Y). (B) Nuclear size of PSC-MSCs after culturing in Y, NDM, and SF+Y as quantified by Image J software. Nuclei were be detected by Hoechst 33342 (blue fluorescence). *p < 0.05; **p < 0.01; ***p < 0.005; N.S., not significant. (C) Gene expression of MAP2 in PSC-MSCs after culturing in Y, NDM, and SF+Y as quantified as analyzed by qPCR. All results are shown as mean ± SEM of three independent experiments. *p < 0.05; **p < 0.01; compared to control. Scale bar: 20 μm.

