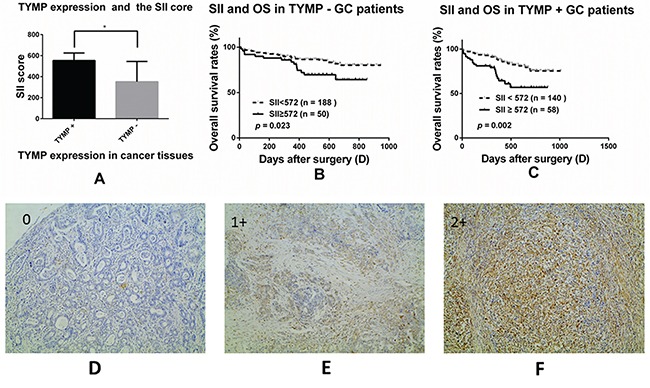
Figure 2. The prognostic significance of the SII in GC patients with different thymidine phosphorylase (TYMP) expression subgroups.

The correlation between the SII and TYMP expression A., *, p = 0.026; Kaplan-Meier analysis of OS for the SII in TYMP negative B. and TYMP positive patients C.; Immunohistochemical staining for TYMP in cancer tissues (original magnification × 100). TYMP = 0, less than 10% of the cancer cells were TYMP-positive D.; TP = 1+, more than 10% but less than 50% of the cancer cells were TYMP-positive E.; TP = 2+, more than 50% of the cancer cells were TYMP-positive F.. TYMP = 0 was considered as TYMP negative while TYMP = 1+ or 2+ was considered as TYMP positive.
