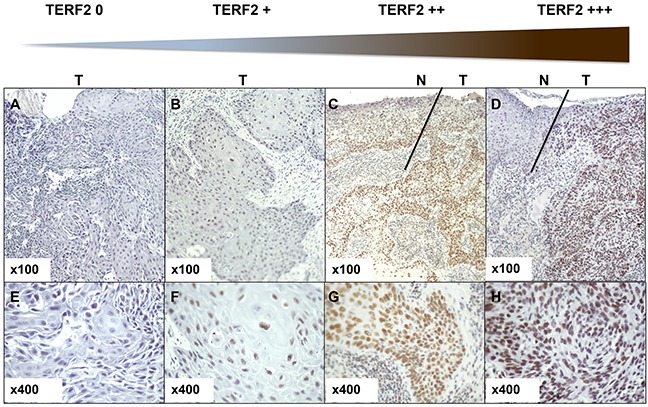
Figure 1. Determination of the TERF2 expression score. Immunohistochemical staining for TERF2 shows different expression levels in tumor cells from TERF2 0 to TERF2 +++. A–C. Panels indicate 100x magnification and E-H 400x magnification. N indicates normal tissue and T tumor tissue. Variation in the immunohistochemical stain was quantified by multiple lectures by three pathologists (DA, HR and AS). The different levels of staining and the number of cells stained in the tumor sections were taken into account to define scores from 0 to +++ (0 absence of nuclear staining; +1 weak nuclear staining; +2 At least 30% of tumor cells with a moderate nuclear staining; +3 At least 30% of tumor cells with a strong nuclear staining.

