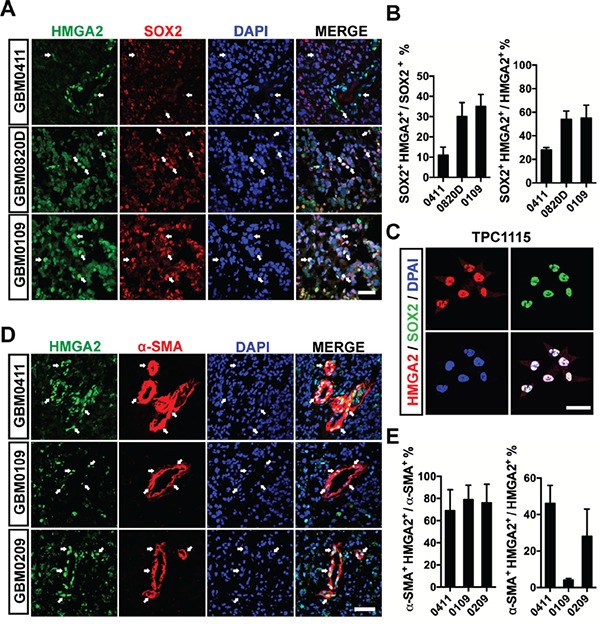
Figure 2. HMGA2 labels GICs and pericytes in glioma tissues.

A. Representative immunofluorescent images showing co-expression of HMGA2 and SOX2 in three GBM samples. B. Quantification of co-localization of HMGA2+ and SOX2+ glioma cells of three fields under a 20× object (44,100 μm2 per field). C. Co-localization of HMGA2 and SOX2 in primary glioma-initiating cells, TPC1115. D. Representative immunofluorescent images showing co-expression of HMGA2 and α-SMA in three GBM samples. E. Quantification of co-localization of HMGA2+ and α-SMA+ glioma cells of three fields under a 20× object (44,100 μm2 per field). Arrows indicate HMGA2-expressing GBM cells. Scale bars: (A and D) 50 μm; (C) 40 μm.
