
Figure 5. HMGA2 facilitates the expressions of FOXM1 and PLAU.
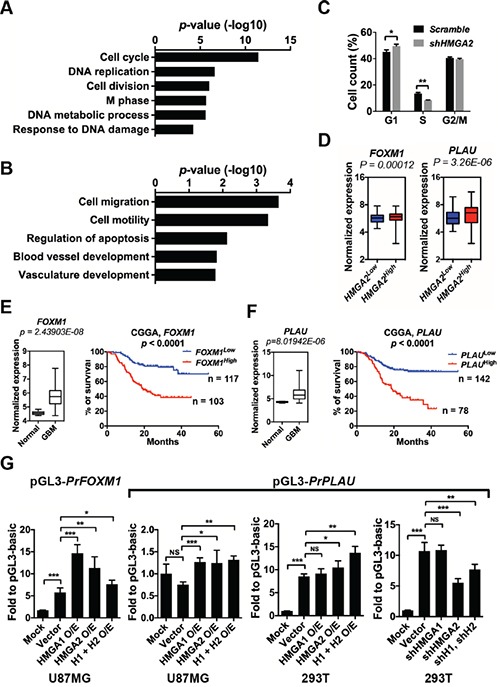
A. Gene Ontology (GO) analyses of commonly down-regulated genes in TPC1115 GICs depleted with HMGA2, HMGA1 and HMGA2/HMGA1. B. List of GO terms summarizing down-regulated genes in TPC1115 GICs depleted with HMGA2. C. Cell cycle changes of TPC1115 GICs upon knockdown of HMGA2. D. Box plots showing normalized expressions of FOXM1 and PLAU metagene in HMGA2Low and HMGA2High GBMs using data retrieved from TCGA. P values were determined using a nonparametric Wilcoxon test. HMGA2low (n = 471) and HMGA2high (n = 87) expression groups were defined using the minimum P-value approach (maximal chi square statistics approach). E-F. Left: expression levels of FOXM1 (E) and PLAU (F) in 10 normal brains and 557 GBM samples using data retrieved from TCGA; right: Kaplan-Meier survival plots showing correlations of glioma patients' survival with expression levels of FOXM1 (E) and PLAU (F) using the CGGA (Chinese Glioma Genome Atlas) dataset. G. Dual-luciferase assays showing relative luciferase activities of FOXM1 and PLAU promoter fragments (PrFOXM1 and PrPLAU) in U87MG and 293T cells transfected with indicated vectors. O/E, overexpression; H1, HMGA1; H2, HMGA2.