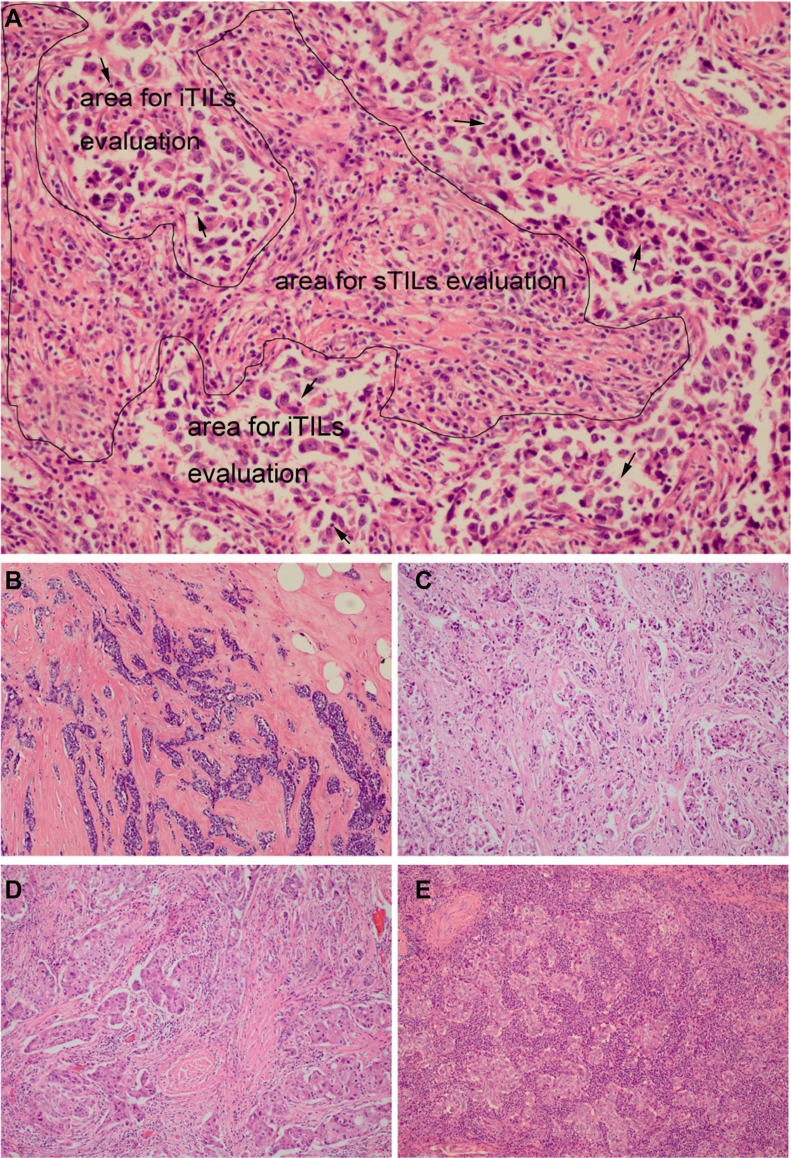
Figure 1. Different scores of tumor-infiltrating lymphocytes (TILs) in TNBCs.
(A) sTILs evaluation area was marked with the black borders and iTILs evaluation area was marked with the black arrow (sTILs 31–40%; iTILs 1–10%); (B) sTILs: 0%; (C) sTILs: 1–10%; (D) sTILs: 11–20%; (E) sTILs: 61–70% (A x200 magnification, B, C, D and E x100 magnification).

