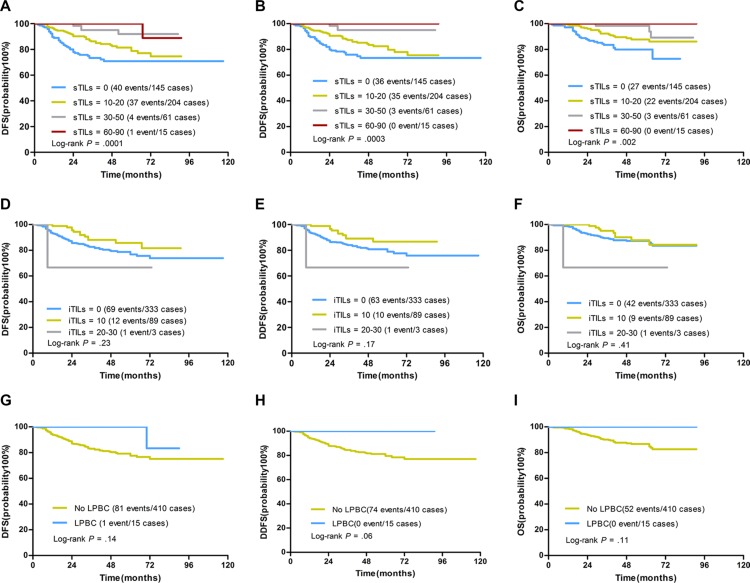
Figure 3. Kaplan-Meier curves for associations of TILs with DFS, DDFS and OS in TNBCs.
(A–C) DFS, DDFS and OS by sTILs (grouped as 0 [defined as 0% to 1%] v 10–20 [1% to 20%] v 30–50 [21% to 50%] v 60–90 [51% to 90%]). STILs scores were significantly associated with DFS, DDFS and OS. (D–F) DFS, DDFS and OS by iTILs (grouped as 0 [defined as 0% to 1%] v 10 [1% to 10%] v 20–30 [11%-30%]). ITILs were not associated with DFS, DDFS and OS. (G-I) DFS, DDFS and OS by sTILs as a dichotomized variable (LPBC: sTILs ≥ 50%; No LPBC: sTILs < 50%). LPBCs were associated with DFS, DDFS and OS but did not reach significance by Log-rank test (Log-rank P values were shown).

