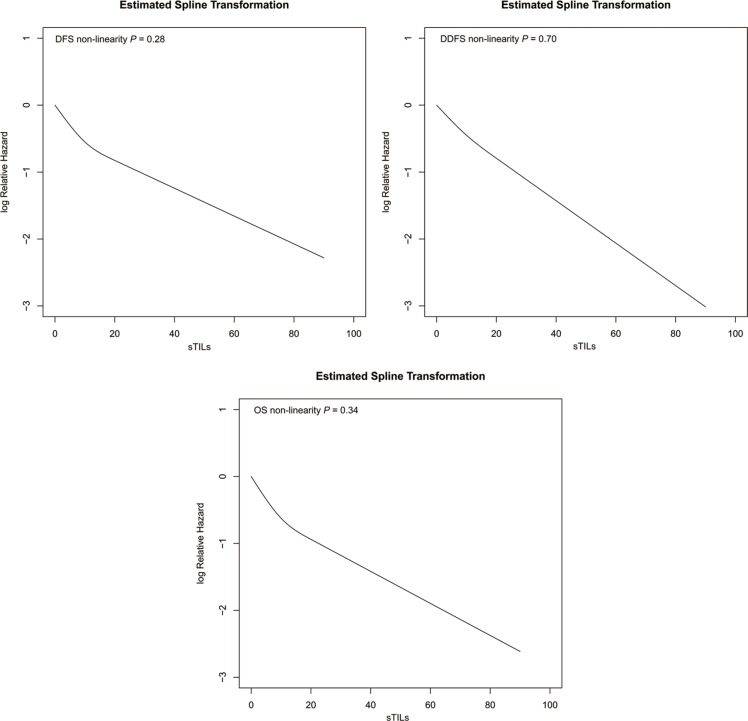
Figure 5. Relationship between continuous sTILs scores and the relative hazard for DFS, DDFS and OS produced by restricted cubic splines models in TNBCs.
Y axis represented the Log Relative Hazard values; X axis represented continuous sTILs scores. Restricted cubic splines detected no significant departures from linearity between sTILs and relative hazard for DFS (P = 0.28), DDFS (P = 0.70), and OS (P = 0.34).

