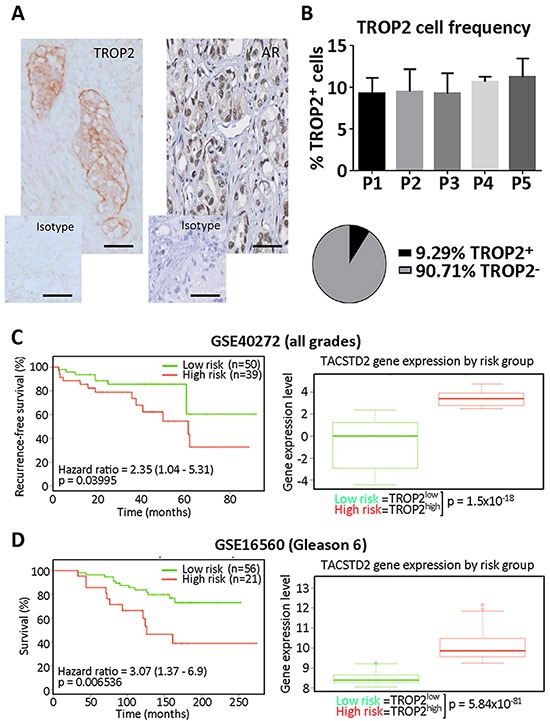
Figure 1.
A. Representative microphotograph depicting tumors cells positively stained with selective antibodies against TROP2 (left) and the androgen receptor (AR, right) in a human prostate carcinoma slide, compared with the same slide stained with the isotype control antibodies. Scale bars = 50μm. B. Top, frequency of cells displaying TROP2 staining at the cell membrane (expressed as percent of tumor cells) in tissue sections from 5 patients (P1-5) with prostate carcinoma (P1: unknown Gleason grade; P2: Gleason >9; P3: Gleason = 9; P4: Gleason = 6; P5: Gleason = 6); Bottom, pie chart summarizing the mean percentage of TROP2 positive and TROP2 negative cells across all patients. C. Kaplan-Meier curve showing the recurrence-free survival (left) and box-plot showing TROP2 expression levels (right) in Low and High risk prostate cancer patient groups (Data from GSE40272, total number of samples = 89). Expression data is provided as median and 5-95 percentile in each patient group. D. Kaplan-Meier curve showing the overall survival (left) and box-plot showing TROP2 expression levels (right) in Low and High risk groups from patients with Gleason 6 prostate cancer (Data from GSE40272, total number of samples for this grade = 77). In C and D, hazard ratios with their confidence interval are provided (left), as well as p values for the log-rank testing equality of survival curves (left) and for the difference between TROP2 expression in low- and high-risk groups, using t-test (right). TROP2 expression data is provided as median and 5-95 percentile in each patient group.

