
Figure 3. High levels of Tregs and TGF-β1 are present in patients with ovarian cancer.
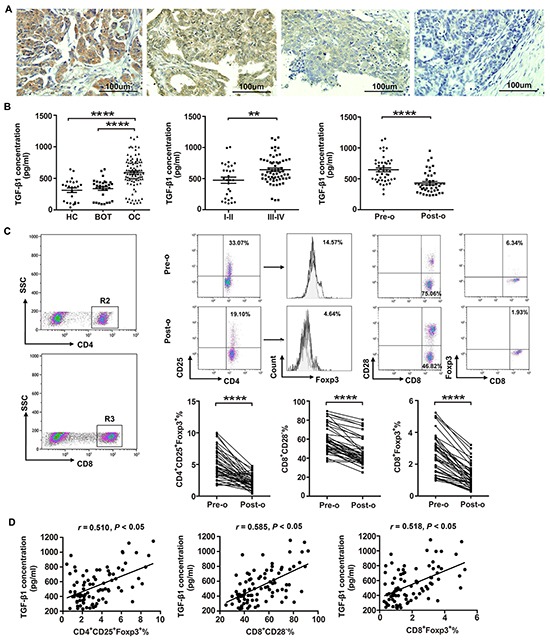
A. Representative images depicting immunohistochemical staining of TGF-β1 in ovarian cancer tumor tissues. Original magnification: × 200. B. Levels of TGF-β1 in patients with OC (n=92), BOT (n=31), and healthy controls (HC; n=24) were determined by ELISA. ****P<0.0001 compared with BOT or HC groups. Cumulative data showed that TGF-β1 levels in OC patients at stage III/IV (n=63) was higher than that in patients at stage I/II (n=29). **P<0.01. C. CD8+ and CD4+ T cells were selected for further analysis by flow cytometry. Representative dot plot of CD4+CD25+Foxp3+, CD8+CD28−, and CD8+Foxp3+ T cell levels in peripheral blood from patient pre-operation (pre-o) and post-operation (post-o). ****P<0.0001. Statistical analysis showed that the percentages of CD4+CD25+Foxp3+, CD8+CD28−, and CD8+Foxp3+ Treg cells are significantly dropped in OC patients after surgery. ****P<0.0001. D. Pearson correlation analysis between the percentages of CD4+CD25+Foxp3+, CD8+CD28−, and CD8+Foxp3+ Treg cells and TGF-β1 expression level in OC patients. *P<0.05.