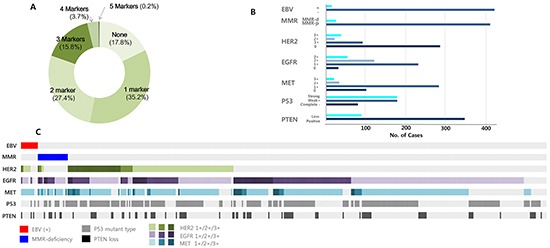
Figure 2. Patterns and frequencies of 10 molecular markers.

A. Profile of the number of positive markers. B. IHC/ISH expression of each marker is shown across samples. The vertical line shows the name and expression of the markers and the horizontal line indicates sample numbers. C. Integrated description of expression profiles.
