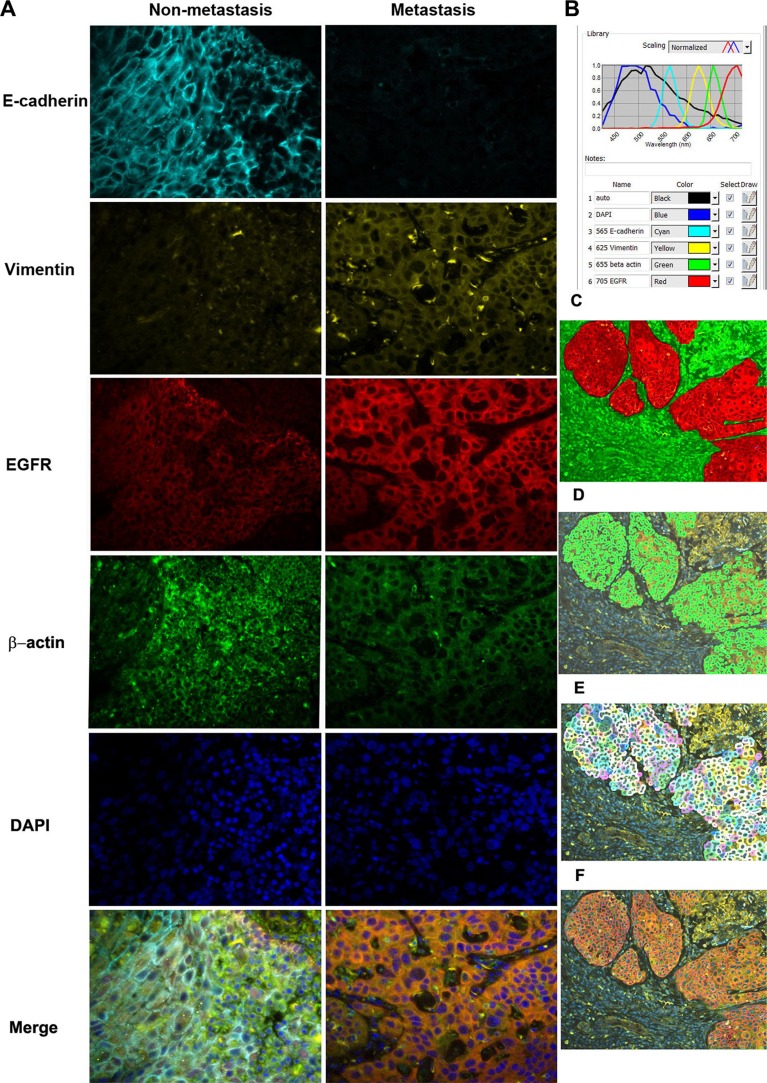
Figure 2. Simultaneous detection of three biomarkers plus control using QD-based IHF system.
(A) library composed of DAPI, auto-fluorescence, QD565, QD625, QD655, and QD705 was initially set for the analysis. Signals in the image cube were unmixed according to their wavelengths in the library and then the corresponding signals were separated. E-cad is shown in cyan, EGFR in red, cytoplasmic vimentin in yellow, and β-actin in green. A: The expression of three biomarkers in primary tumors from patients with or without LNM. (B) Quantum dot library (normalized spectrum). C-F: segmentation of cancer cell from stroma (C), nucleus (D), cytoplasm (E), and membrane (F).

