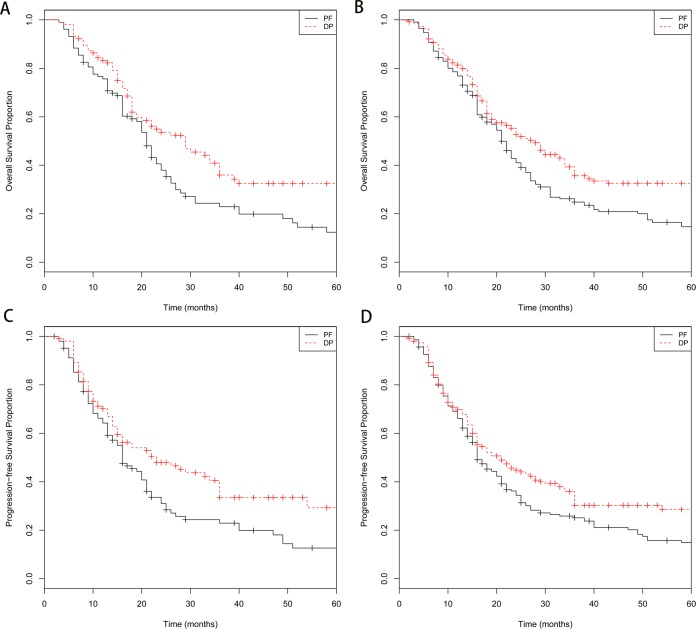
Figure 1. Kaplan-Meier survival curves for patients stratified by treatment with docetaxel/cisplatin (DP) versus fluorouracil/cisplatin (PF).
A. Kaplan-Meier survival curves of overall survival (OS) time in the propensity score-matched cohort (P = 0.009); B. inverse probability of treatment weighted (IPTW)-adjusted Kaplan-Meier estimates of OS time curves in the whole cohort (P < 0001); C. Kaplan-Meier survival curves of progression-free survival (PFS) time in the propensity score-matched cohort (P = 0.010); D. IPTW-adjusted Kaplan-Meier estimates of PFS time curves in the whole cohort (P = 0.004).

