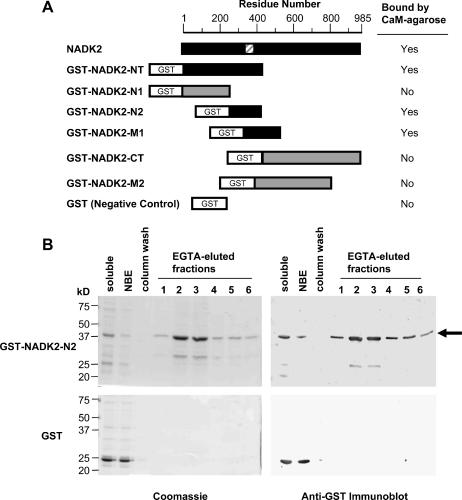
Figure 6.
Mapping of the CaM-binding domain of NADK2. A, Different regions of NADK2 were expressed in E. coli as recombinant GST-fusion proteins and tested for their ability to bind to a CaM-agarose affinity column in a calcium-dependent manner. A schematic of the GST-fusion constructs tested shows their positions relative to the full-length NADK2. Black boxes denote recombinant proteins that were able to bind to CaM-agarose, whereas gray boxes indicate proteins that did not bind CaM. The striped box indicates the position of the delineated CaM-binding domain. B, A typical example of how GST-NADK2 fusion proteins described in A (data for GST-NADK2-N2 is shown) and CaM-affinity chromatography were used to delineate the CaM-binding domain of NADK2. Left and right panels show Coomassie-stained SDS-PAGE gels and anti-GST immunoblots, respectively, of the EGTA-elution profile from a CaM-affinity column for E. coli extracts containing either GST-NADK2-N2 fusion protein (top panels) or control GST (bottom panels). For Coomassie-stained gels (left panels), about 10 μg protein of bacterial soluble extract (soluble) or nonbinding eluate (NBE) was loaded for both the GST-NADK2-N2 and GST samples. EGTA-eluted fractions (lanes 1–6) were loaded on an equal volume (30 μL) basis to show the GST-fusion protein elution profile. The immunoblots (right panels) correspond to the Coomassie-stained gels with the exception that one-third the amount of sample was loaded per lane. A black arrow indicates the position of GST-NADK2-N2.

