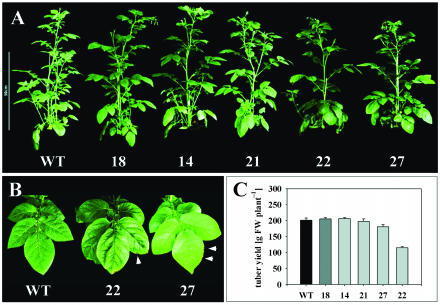
Figure 5.
Growth response, leaf morphology, and tuber yield of tocopherol-deficient potato plants. A, Visible phenotype of transgenic lines and wild type after 9 weeks in the greenhouse. Bar represents 50 cm. B, Phenoytpic alterations of lower source leaves from StSXD1-RNAi-22 and -27 compared to wild type. Arrowheads indicate necrotic spots at the leaf margins. C, Tuber yield of StSXD1-RNAi and wild-type plants grown for 13 weeks in the greenhouse. Data represent means ± se of 5 plants.

