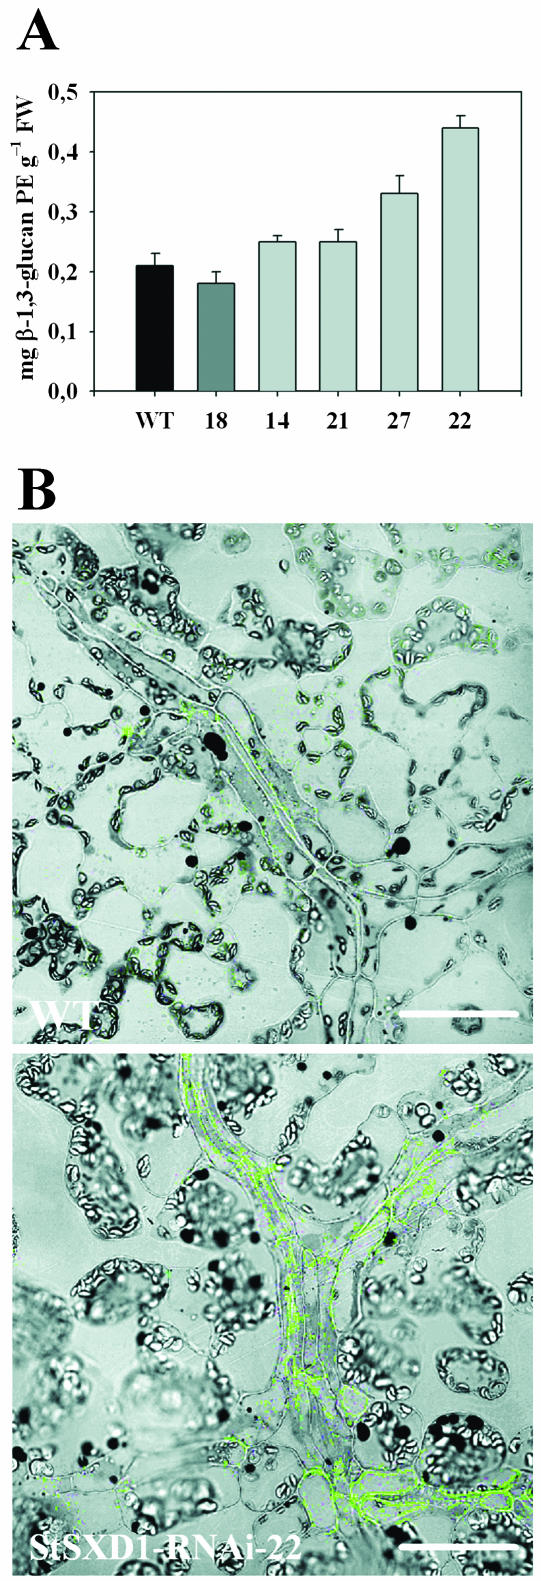
Figure 6.
Callose concentrations and distribution in source leaves of tocopherol-deficient potato plants. A, Callose contents in lower source leaves (leaf 11 from the top) of 59-d-old potato plants at the end of the photoperiod. Data represent the means (n = 5) ± se and are given as β-1,3-glucan pachyman equivalents. B, Immunofluorescence analysis of vascular-specific callose accumulation in StSXD1-RNAi-22 compared to wild type. Samples were taken from lower source leaves of 59-d-old potato plants and callose was detected in longitudinal section using a monoclonal anti-β-1,3-glucan antibody and Alexa Fluor 488 antimouse IgG as fluorescence marker. Callose-derived fluorescence signals in vein class III-associated cells were detected by confocal laser scanning microscopy and superimposed with bright field images. Bars represent 50 μm.

