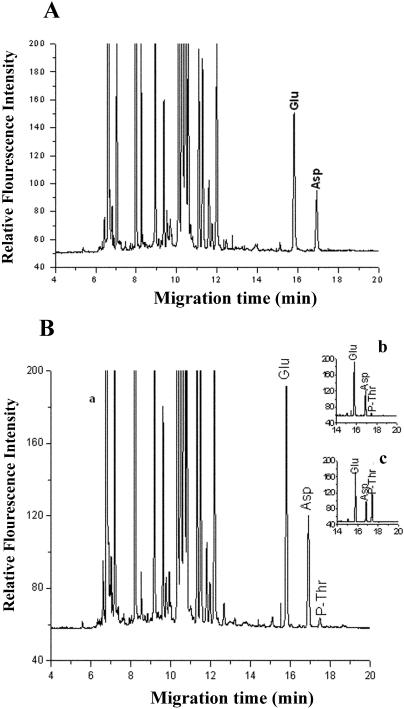
Figure 12.
Phosphoamino acid analyzed by capillary electrophoresis. A, Electropherogram of the hydrolyzed unphosphorylated NtCaMK1 with FITC labeling. B, Electropherograms of the hydrolyzed autophosphorylated NtCaMK1 with FITC labeling. a, Whole electropherogram; b, electropherogram intercepted from a and c; c, electropherogram with addition of standard P-Thr to phosphorylated NtCaMK1 sample to indicate phosphorylated Thr residue.

