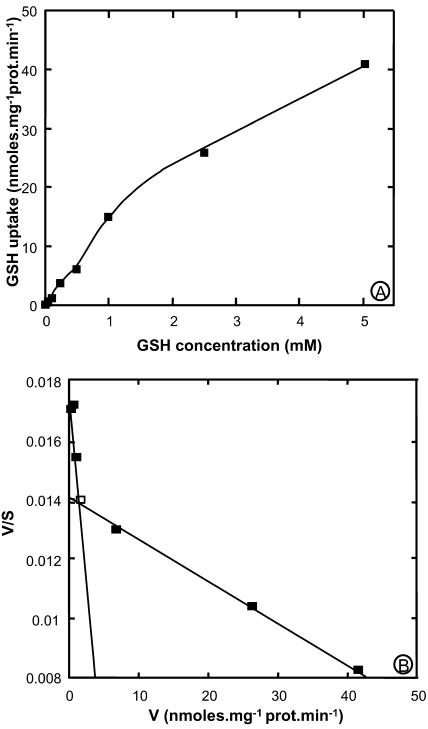
Figure 3.
Kinetic analysis of [3H]GSH uptake by yeast strain ABC 822 (hgt1) expressing AtOPT6. Initial rates of uptake of GSH were measured with yeasts carrying either the pDR/AtOPT6 construct or pDR alone. Background uptake measured with the strain carrying the empty plasmid was subtracted from uptake measured with the pDR/AtOPT6 strain, and the data were plotted according to Michaelis-Menten (A) and Eadie-Hofstee (B). The latter representation yields straight lines of slope −1/Km and ordinal intercept V/Km. V is given is nmol glutathione absorbed per min and per mg protein.

