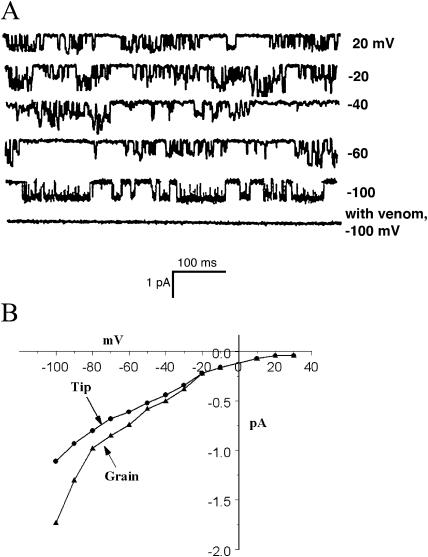
Figure 3.
The SA Ca2+ channel. A, Sweeps from an outside-out patch containing an SA Ca2+ channel. As with the SA K+ channel (Fig. 2), no channel activity was detected in the absence of pressure or the presence of 10 μm Gd3+. In some sweeps, two channels could be seen, as well as channel substates. B, The I-V curve for the SA Ca2+ channels from 25 patches. The curves are approximately linear for negative holding potentials. Also included here are the data from patches pulled from tip protoplasts (see text and Fig. 4).

