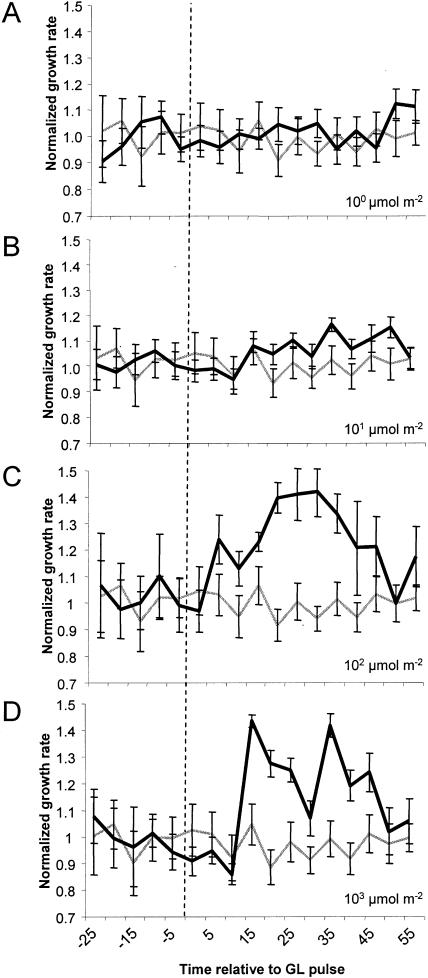
Figure 3.
The fluence-response characteristics of stem growth promotion by GL. Individual seedlings were grown in darkness then were imaged for measurement in 1 h of darkness to establish a dark-growth rate. A short, single pulse of GL of varying fluence was applied, and the growth kinetics were measured for 1 h. The averaged normalized response of wild-type (Col-0) seedlings is presented following a 100 μmol m−2 (n = 19; A), 101 μmol m−2 (n = 22; B), 102 μmol m−2 (n = 21; C), or 103 μmol m−2 (n = 20; D) GL pulse of short duration (1–50 s). The gray line represents the mean growth rate of many dark-grown seedlings subjected to a mock pulse. The vertical dashed line represents the point when the pulse was delivered. The data were normalized to the dark rate (1), derived from the average growth rate 30 min prior to the light pulse. Error bars represent se of the mean.

