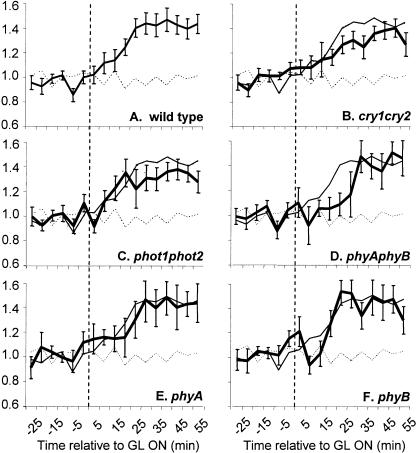
Figure 5.
Genetic analysis of growth promotion in response to constant dim GL. Dark-grown seedlings were prepared, imaged, and analyzed as described in “Materials and Methods.” The growth kinetics of photoreceptor mutant seedlings were monitored in response to continuous GL delivered at 2 × 10⁻¹ μmol m−2 s−1 after 0 min (vertical dashed line). The mean growth response is shown for wild-type seedlings (A), cry1cry2 (B), phot1phot2 (C), phyAphyB (D), phyA (E), and phyB (F) mutants, represented by the thick-black line. For comparison, wild-type growth kinetics induced by the same treatment are represented by a thin-black line in all panels. A dark control is shown as a dashed line. Between 15 and 25 individual seedlings were imaged per mutant line per light treatment. Error bars represent the se of the mean.

