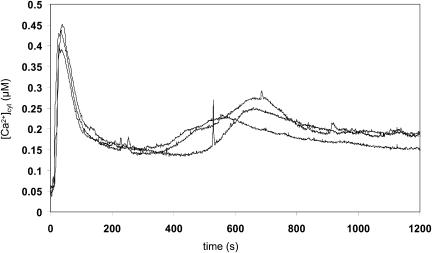
Figure 1.
Increase in [Ca2+]cyt in response to H2O2 [Ca2+]cyt was measured by luminometry as described in “Materials and Methods.” For each measurement, an individual 7-d-old reconstituted RLD1.1 seedling was placed into a plastic cuvette containing 0.5 mL water. H2O2 (final concentration 10 mm) was added. At 1,200 s, remaining aequorin was discharged. Traces represent the responses of three individual seedlings per treatment.

