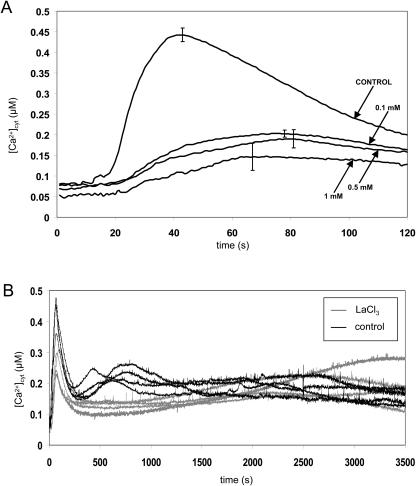
Figure 3.
Effect of the Ca2+ channel blocker LaCl3 on the H2O2-induced [Ca2+]cyt signature [Ca2+]cyt was measured by luminometry as described in “Materials and Methods.” A, Inhibition of the early [Ca2+]cyt peak by LaCl3. Seven-day-old reconstituted RLD1.1 seedlings were incubated for 1 h in LaCl3 solution (concentrations indicated in the legend) or water (control) prior to transfer into plastic cuvettes. H2O2 (final concentration 10 mm) was added at 5 s. At 120 s, remaining aequorin was discharged. Traces represent the mean of 4 seedlings with error bars indicating se at that time point. B, Effect of LaCl3 on the late H2O2-induced [Ca2+]cyt peak. Seven-day-old reconstituted RLD1.1 seedlings were incubated individually in 0.1 mm LaCl3 solution or water (control) for 30 min inside a plastic cuvette. H2O2 (final concentration 10 mm) was added at 5 s. At 3,600 s, remaining aequorin was discharged. Traces represent the responses of 3 individual seedlings per treatment.

