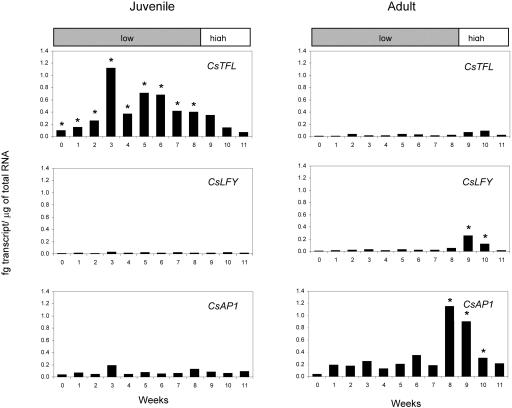
Figure 7.
Extrapolated quantities of CsTFL, CsLFY, and CsAP1 transcripts in adult (right panels) and juvenile (left panels) citrus stems. Standard curves for CsLFY, CsTFL, and CsAP1 were constructed as described in “Materials and Methods” (data not shown). Quantities of CsTFL, CsLFY, and CsAP1 RNAs per 1 μg total RNA were extrapolated from these curves. Ct values were normalized using Csβ-actin as covariate. Each time point represents the average of three technical replicates and the least squared mean of 3 biological replicates as described in “Material and Methods”. Asterisks indicate a statistically significant difference (P < 0.05) using pairwise comparisons at each time point between adult and juvenile tissue for either CsTFL, CsLFY, or CsAP1. Gray and white bars indicate time points plants were subjected to low (15°C) or high (24°C) day-time temperatures, respectively.

