Figure 1.
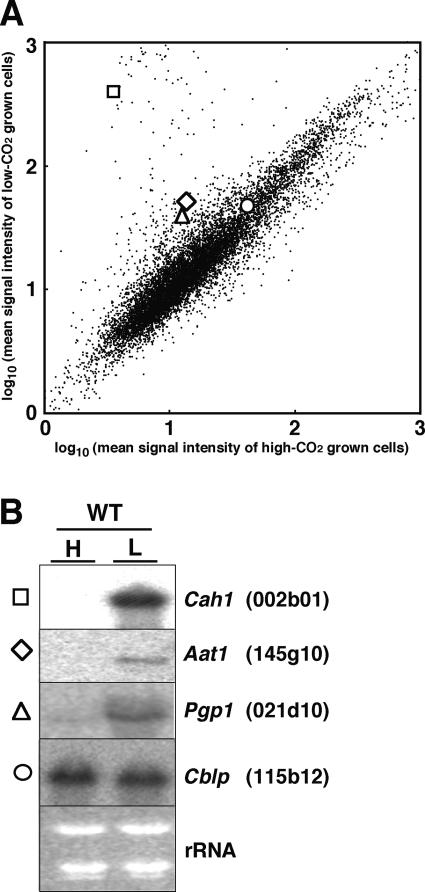
Scatter plot of hybridization signals in the cDNA array (A) and northern-blot analyses of representative low-CO2 inducible genes (B). Mean signal intensities in hybridization with probes from high-CO2 grown wild-type cells and low-CO2 grown wild-type cells were plotted along the x and y axes, respectively. The signal intensities of Cah1 (clone ID 002b01, square), Aat1 (clone ID 145g10, diamond), Pgp1 (clone ID 021d10, triangle), and Cblp (clone ID 115b12, circle) are highlighted. B, Ten micrograms of total RNA from either high-CO2 grown (H) or 1-h low-CO2 adapted wild-type cells (L) were hybridized with 32P-labeled Cah1, Aat1, Pgp1, and Cblp gene-specific probes.

