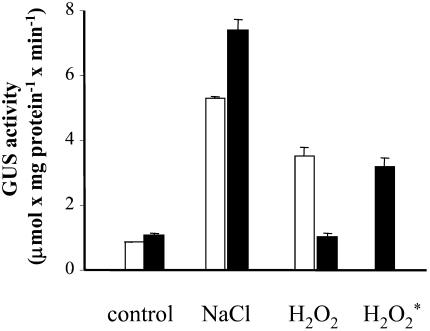
Figure 8.
Effect of catalase on salt- and H2O2-induced expression of the gpx1 promoter:uidA fusion in tobacco cells. For details, see Figure 3. Bovine liver catalase, at a concentration of 130 U mL−1 was added prior to salt or H2O2, except when indicated by an asterisk, where catalase was added 30 min after the addition of H2O2. NaCl and H2O2 were added at 0.2 m and 10 mm, respectively. White bars, no catalase; black bars, with catalase.

