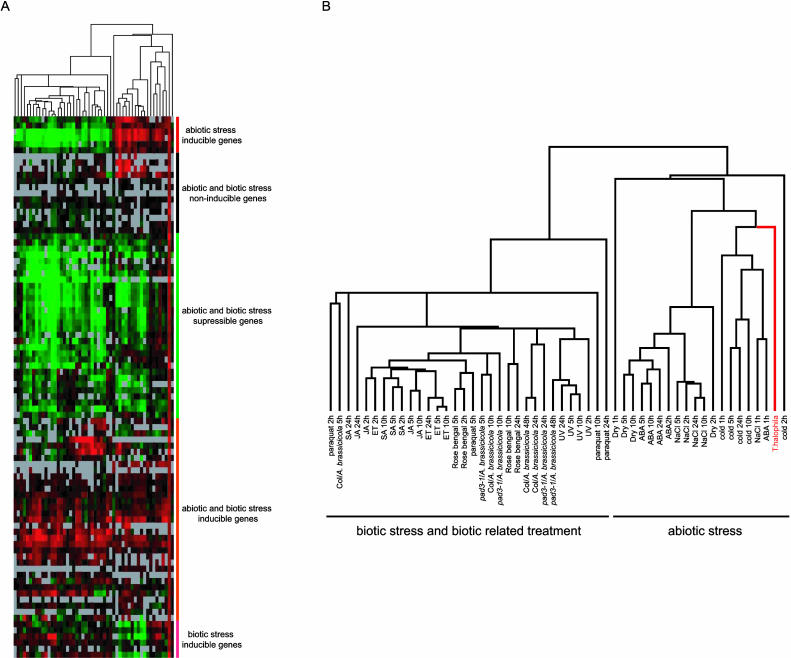
Figure 4.
Hierarchical clustering among the genes highly expressed in salt cress and the results of microarray analyses that included various abiotic stress treatments or various biotic stress and biotic-related treatments of Arabidopsis using this Arabidopsis cDNA microarray. A, Overview of the hierarchical cluster display. The fold change values for each sample, relative to untreated control samples, were log2 transformed and subjected to complete linkage hierarchical clustering. Expression values higher and lower than those of the control are shown in red and green, respectively. As absolute value of fold difference increased, the color intensity increased. The bars at the right end indicate five rough groups: abiotic, biotic, both abiotic and biotic stress-inducible genes, abiotic and biotic stress-suppressible genes, and abiotic and biotic stress-noninducible genes. B, The expansion figure of A. The relationship among experiments across all of the genes included in the cluster analysis and the type of each experiment are indicated (for details, see Seki et al., 2002a, 2002b; Narusaka et al., 2003).

