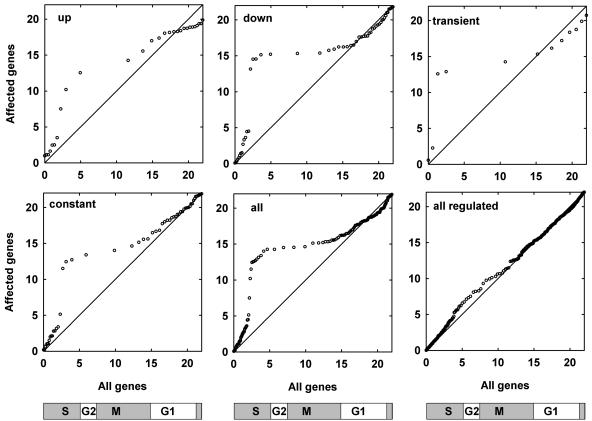
Figure 5.
Cell cycle regulation of reproductive genes. Quantile-quantile plots were constructed based on various subsets of reproductive genes that were expressed also in a cell-suspension culture. For each gene of a subset, times of peak expression during the 22-h cell cycle were used and plotted versus all cell cycle regulated genes in the suspension culture. Data points along the diagonal indicate a similar distribution of expression peaks of the selected subset and the entire population of cell cycle regulated genes. A slope ≫1 results if fewer genes than expected from the subset show maximal expression within a certain time window. Conversely, a slope close to 0 shows that more genes than expected from the subset show maximal expression within this time window. The schemes below the plots indicate cell cycle phases.

