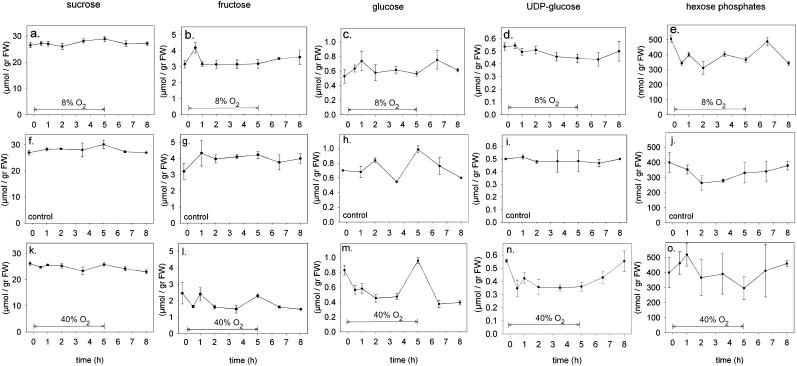
Figure 4.
Intermediates of the Suc to starch metabolic pathway during the course of an experiment in which oxygen was decreased to 8% (A–E), unchanged (F–J), or increased to 40% (K–O) for the period of 5 h as indicated by the arrow. Suc is shown in A, F, K; Fru in B, G, L; Glc in C, H, M; UDP-Glc in D, I, N; and the hexose-phosphates (Glc-1-phosphate, Glc-6-phosphate, and Fru-6-phosphate) are shown in E, J, O. Data represent the means ± se of at least three measurements for every single point in time.

