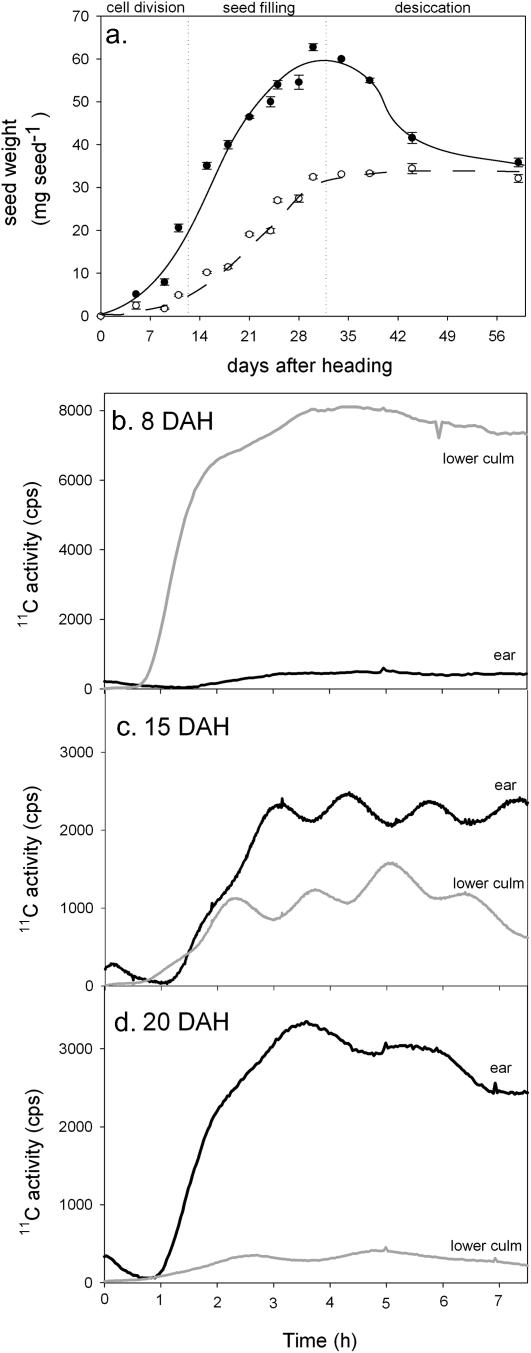
Figure 7.
Seed development in wheat plants and changes in phloem transport. A, Changes in seed fresh weight (•) and dry weight (○) during development. B to D, Phloem transport toward the ear (black line) and a part of the culm below the node at which the flag leaf is attached (gray line). 11C-labeled photoassimilates were measured with radiation detectors placed around the plant. About 2 h of continuous labeling was needed to reach steady state between uptake and release of labeled carbon in the labeling zone. B, Plants 8 DAH, just before seed filling. C, Plants with seeds 15 DAH, early in the seed filling stage. D, Plants with seeds 20 DAH, in the middle of the seed filling stage.

