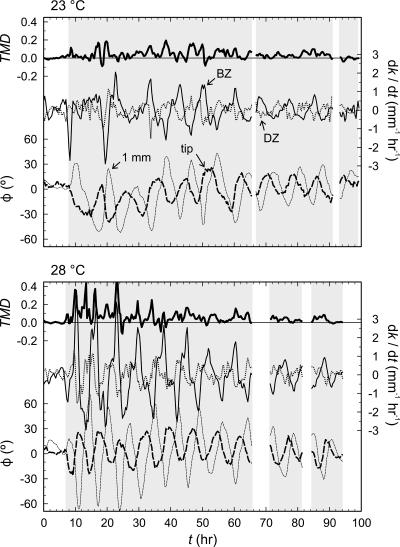
Figure 6.
Tip movement differential (TMD), curvature development (dk/dt) in the distal and basal zones (DZ and BZ), and root angular deviation (φ) from the downward slope of the gel at the tip and 1 mm back from the tip. Gray shading indicates temporal regions in which good spectral data can be resolved (i.e. the gel surface has been turned to 45° and the root tip is still within the field of view).

