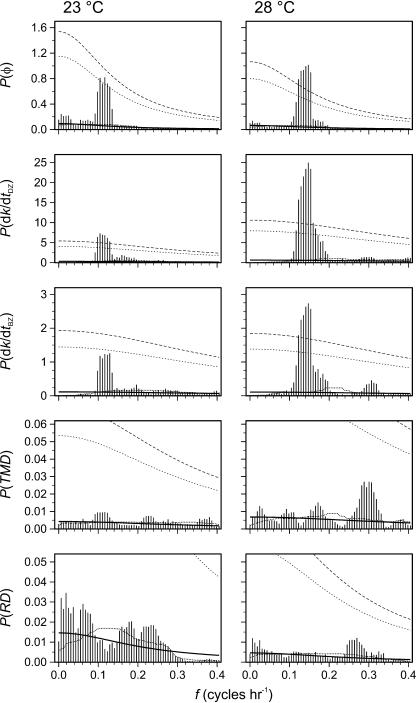
Figure 8.
Spectrum estimates (vertical lines) using the multiple-taper method (Thomson, 1982), with p = 2 (df = 6), of φ, dk/dtDZ, dk/dtBZ, TMD, and RD at both 23°C and 28°C. The spectra are estimated using the shaded data in Figures 6 and 7, with zero padding in nonshaded regions. The background noise level is estimated using 43-bin median window filter (thin dotted line) and least-squares fit (thick solid line) of a red-noise continuous spectrum (see text for details). The 95% (thin short-dashed line) and 99% (thin long-dashed line) χ2 confidence limits against the background spectra are also given.

