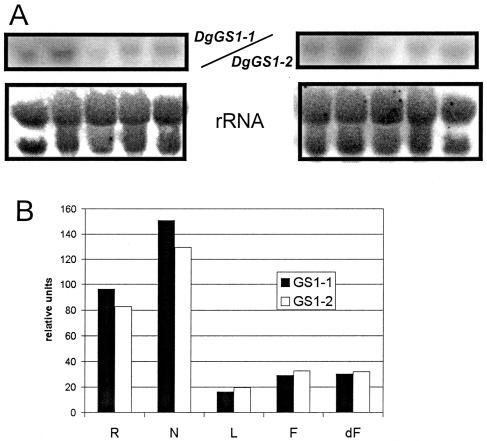
Figure 1.
A, DgGS expression levels in different organs of D. glomerata. Total RNA from organs of D. glomerata (L = leaf, F = flower, dF = developing fruit, R = root, N = nodules; 6 weeks after Frankia inoculation) was hybridized with a gene-specific probe of DgGS1-1 (left) or with DgGS1-2 (right). Hybridization of the organ blots with an rRNA probe is shown in the lower sections. B, Image intensity values of GS1-1 and GS1-2 hybridizations relative to rRNA hybridization.

