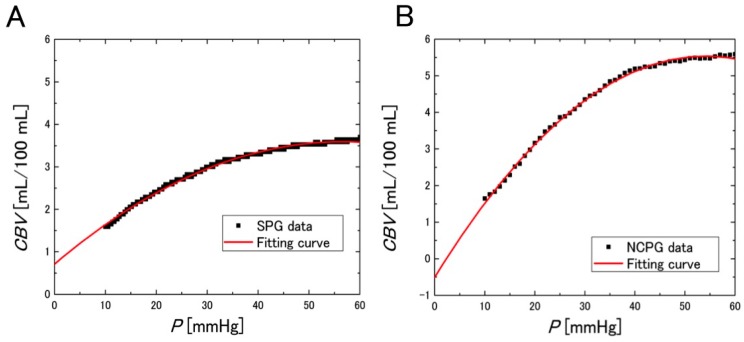
Figure 9.
Observed CBV and quadratic regression curve with respect to the cuff pressure P during the deflation period, acquired with: (A) SPG (regression equation: CBV = 0.711 + 0.102·P − 8.99 × 10⁻⁴·P2, R2 = 0.996, p < 0.0001); and (B) NCPG (regression equation: CBV = −0.503 + 0.223·P − 2.05 × 10⁻³·P2, R2 = 0.998, p < 0.0001). The displayed data were obtained from the measurements of subject 3.

