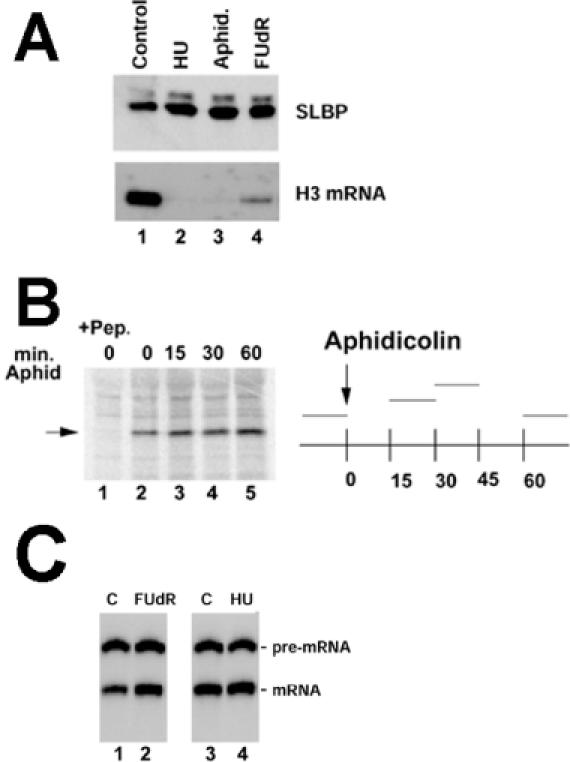
Figure 4.

SLBP levels are not decreased when histone mRNA is degraded. (A) CHO cells were treated with HU, Apd or FUdR for 1 h. Lysates and RNA were prepared and analyzed for SLBP by western blotting (top) or histone H3 mRNA by S1 nuclease mapping (bottom). The slower migrating band represents a small amount of phosphorylated SLBP. (B) CHO cells were pulse labeled with [35S]methionine for 15 min, at the time periods indicated on the graph at the right. Apd was added to the cells at 0 min and then [35S]methionine added at 15, 30 or 60 min. Equal amounts of cell lysate were precipitated with anti-SLBP and the immunoprecipitates analyzed by gel electrophoresis (left); the position of SLBP is indicated by the arrow. In lane 1, the antibody was incubated with the antigenic peptide prior to immunoprecipitation. Above each lane the time in minutes after Apd treatment is indicated. The 0 h points were not treated with Apd (lanes 1 and 2). (C) Nuclear extracts were prepared from exponentially growing mouse myeloma cells (lanes 1 and 3) or mouse myeloma cells treated with FUdR (lane 2) or HU (lane 4) for 1 h. A synthetic radiolabeled 320 nt histone H2a pre-mRNA was incubated in the extract for 30 min, the RNA purified, analyzed by gel electrophoresis and the RNA products detected by autoradiography (20). The position of the substrate pre-mRNA and the 266 nt processed mRNA are indicated.
