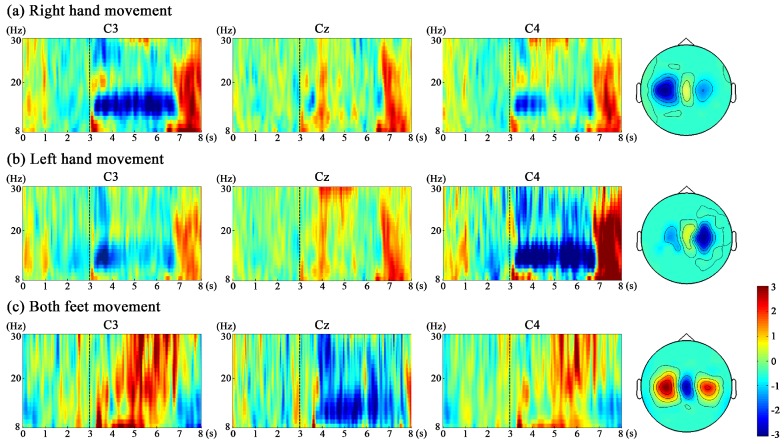
Figure 5.
A representative example of time-frequency maps for ME of three movements from subject 3. (a) time-frequency maps of right hand movement; (b) time-frequency maps of left hand movement; (c) time-frequency maps of both feet movement. For each movement, time-frequency maps of channel C3 over the left sensorimotor cortex, C4 over the right sensorimotor cortex and Cz are illustrated. In the time-frequency map, 3 s means the cue occurrence. The blue color stands for ERD (power decrease), and the red color stands for ERS (power increase). The head topographies corresponding to the best frequency band (12–16 Hz for subject 3) from seconds 4–7 are provided next to the time-frequency maps.

