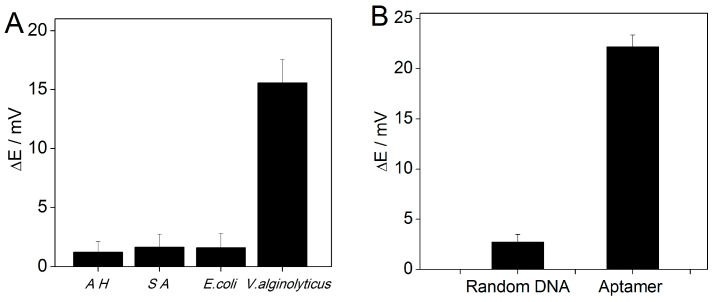
Figure 6.
(A) Potential changes in the presence of 500 CFU mL−1 Aeromonas hydrophila (AH), Staphylococcus aureus (SA), E. coli, and 50 CFU mL−1 V. alginolyticus. (B) Potential responses to 100 CFU mL−1 V. alginolyticus using the aptamer and random DNA-based DNA nanostructures. Error bars represent one standard deviation for three measurements.

