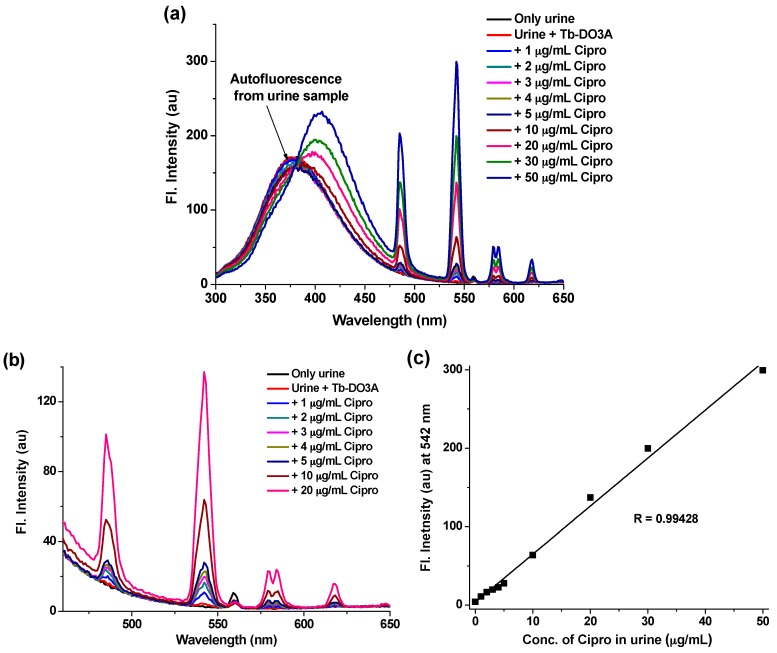
Figure 6.
(a) Full emission spectra of urine, urine treated with Tb-DO3A, and urine treated both with Tb-DO3A and varying concentration of Cipro. The raw urine was diluted 10-times with DI-water. Tb-DO3A was added at a fixed concentration of 20 µM. The Cipro was added at various concentrations ranging from 1 µg·mL−1 to 50 µg·mL−1 with respect to the actual raw urine sample. The spectra were recorded after excitation at 278 nm. (b) The terbium emissions observed at the lower Cipro concentration region, which was produced from (a). (c) The linear intensity changes of terbium emission at 542 nm with increasing concentrations of Cipro, as measured in urine sample.

