
Figure 3.
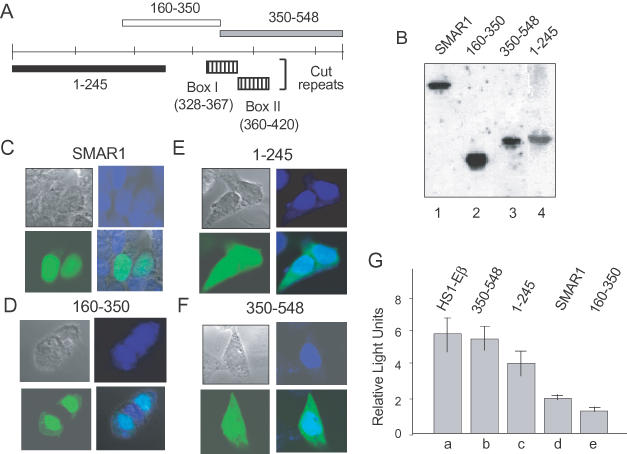
SMAR1 (160–350) contains the NLS and the repression domain. (A) Schematic representation of full-length SMAR1 and SMAR1 truncations (not drawn to scale). The hatched boxes represent the similarity of SMAR1 with the Cut repeat domains of mouse Cux (box I) and human SATB1 (box II). (B) B16F1 cells (2 × 10⁵) were transfected with 1 μg of full-length GFP–SMAR1 and 1 μg of different GFP–SMAR1 truncations. The expression of the transfected constructs was determined by western blot analysis by using anti-GFP antibody as indicated. (C–E) B16F1 cells were transiently transfected with 1 μg of DNAs encoding full-length GFP–SMAR1 (C), GFP–SMAR1 (160–350) (D), GFP–SMAR1 (1–245) (E) or GFP–SMAR1 (350–548) (F). Forty-eight hours post-transfection, localization of the proteins was monitored by direct visualization with an immunofluorescence microscope. GFP–SMAR1 and GFP–SMAR1 (160–350) localizes in the nucleus (C and D) whereas a region from 1–245 and 350–548 show a diffused localization (E and F). Cells were counterstained with DAPI to show nuclear localization. (D) The repressor domain of SMAR1 lies within residues 160–350. (G) The 4980 cells (2 × 10⁶) were transfected with 5 μg of either HS1-Eβ (lane a) or cotransfected with HS1-Eβ in combination with 10 μg of either SMAR1 (350–548) (lane b), SMAR1 (1–245) (lane c), full-length SMAR1 (lane d) or SMAR1 (160–350) (lane e). Forty-eight hours post-transfection, the cells were lysed and processed for dual luciferase assays as described under Materials and Methods. The data shown are the mean ± SD of four independent experiments.