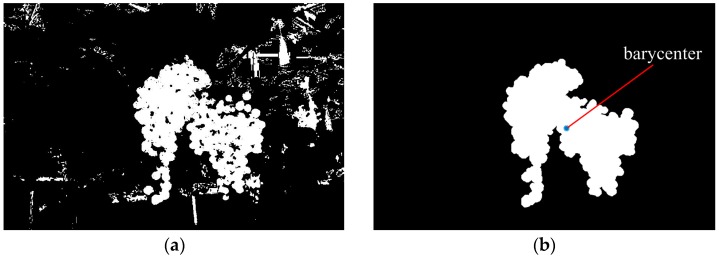
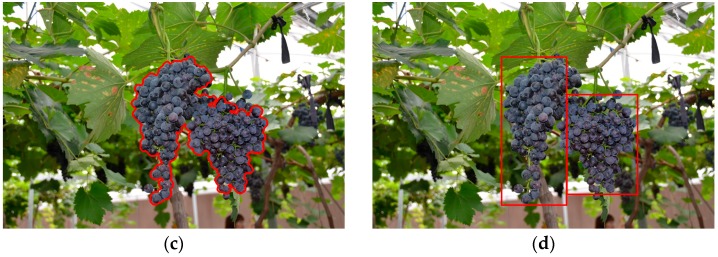
Figure 6.
The detection processes of grape clusters in Figure 3a. (a) Obtained binary image by using the strong classifier; (b) Obtained grape region image after eliminating noises and executing a morphological operation (blue point was the barycenter); (c) The contour of the detected grape clusters; and (d) The enclosing rectangle were drew in the original image.


