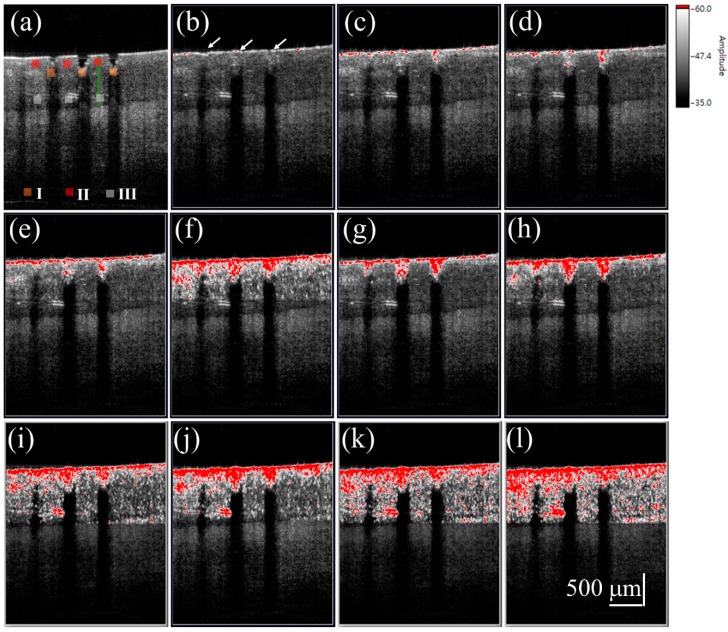
Figure 5.
(a) 2D OCT image of the nail after fractional laser exposure with an exposure energy of 50 mJ. Time-series SV-OCT images of the nail obtained at (b) 0 s; (c) 0.2 s; (d) 0.4 s; (e) 0.6 s; (f) 0.8 s; (g) 1.0 s; (h) 2.0 s; (i) 4.0 s; (j) 6.0 s; (k) 8.0 s; and (l) 10.0 s after the cream drug application. The white arrows indicate that the MAZs were filled with the cream drug. The scalar bar in (l) represents a length of 500 μm in length.

