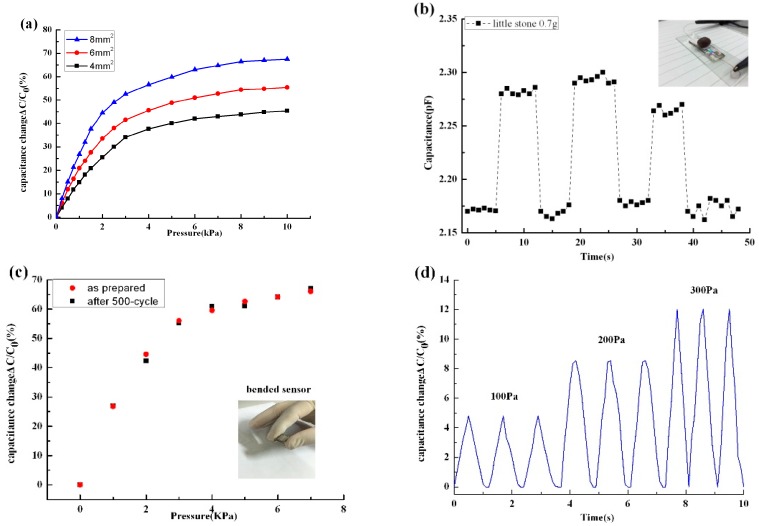
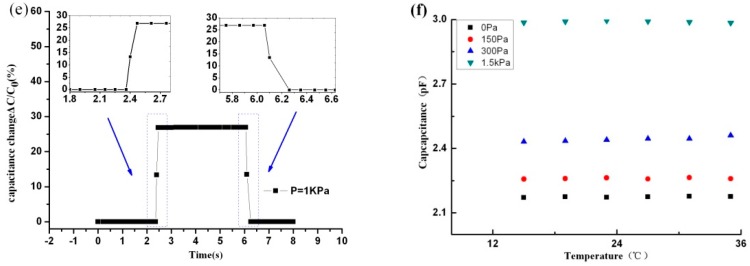
Figure 4.
Characterization of the capacitive pressure response of the pressure sensor. (a) Sensitivity with different sensing area (size = 4 × 4 mm2, 6 × 6 mm2, and 8 × 8 mm2, respectively); (b) Capacitance–time curve for the detection of pressure (100 Pa) according to the loading and unloading of a little stone (0.7 g); (c) Bending stability of pressure response after 500-cycle bending test; (d) Multi-cycle tests of dynamic loading/unloading pressure with different values; (e) Fast response and relaxation time (<200 ms) of the sensor; (f) The curve of thermal drift of the sensor.


