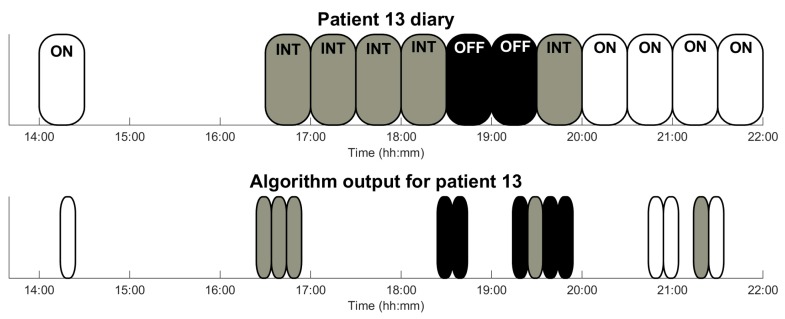
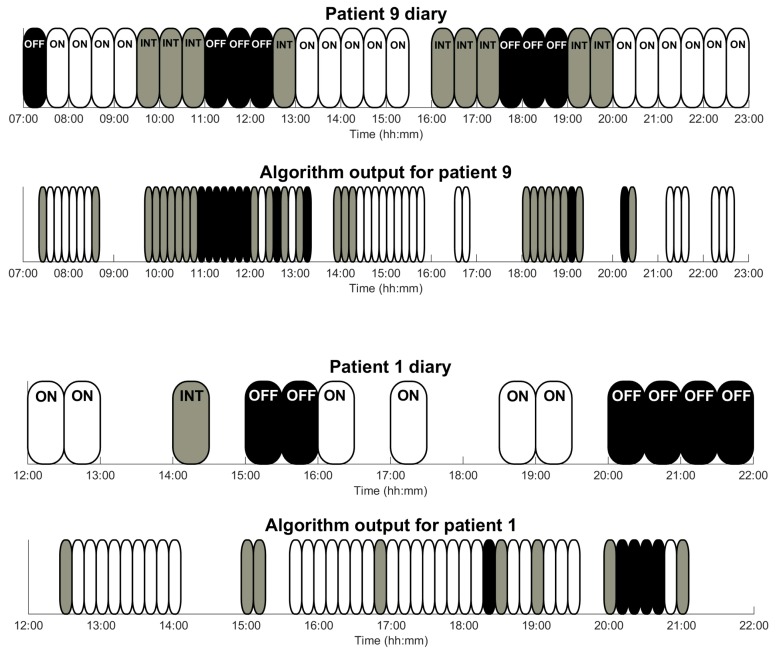
Figure 6.
Graphical output of the algorithm for those patients who had the poorest results (patient 1) and some intermediate results (patients 9 and 13) during a day. Patient’s annotations (upper part) cover, each one of them, a time interval 30 min. Sensor outputs comprise 10 min and follow the same code colour: white corresponds to ON-state, grey to intermediate-state, and black to OFF-state.


