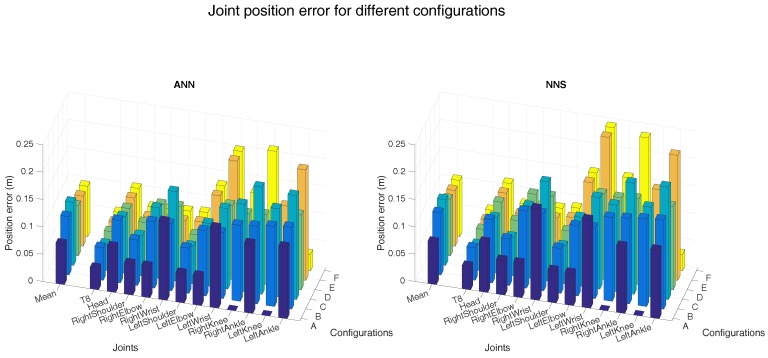
Figure 4.
The left-side of both bar plots (ANN on the left and NNS on the right) shows the mean (over all six subjects) joint position error for the different configurations (as described in Figure 3). Individual mean (over all six subjects) joint position errors are shown on the right-side of both bar plots. A selection of joints is shown in both bar plots for readability. The different spine joints are not shown here because the joint position errors are comparable to the T8 joint. Additionally, the extra shoulder/foot joints are not presented because the magnitude of the error is similar to that of the shoulder and ankle joints shown.

