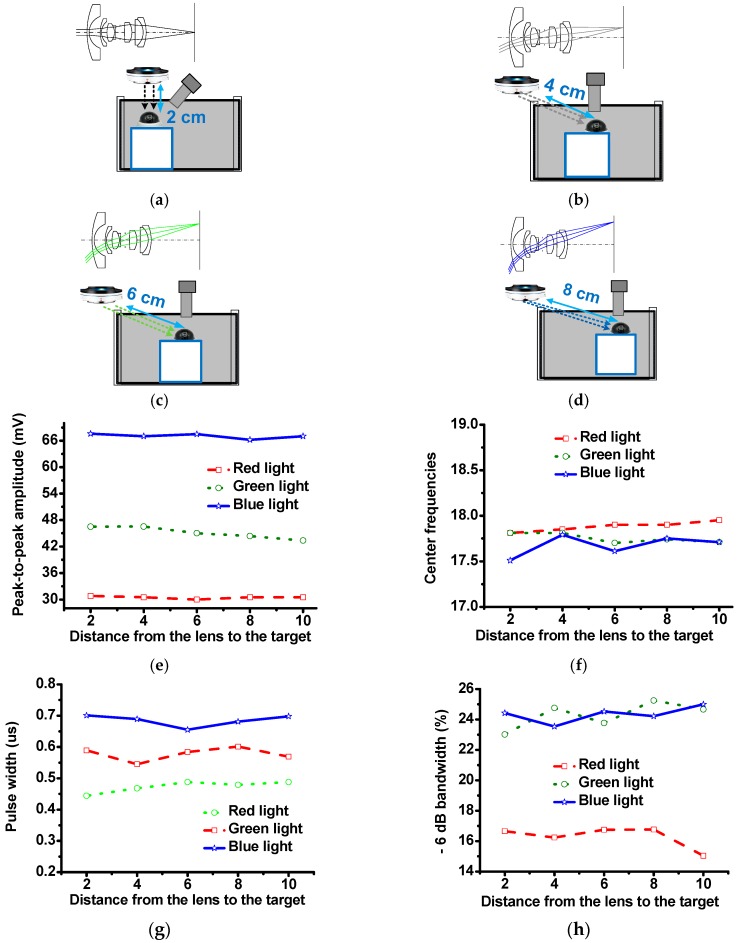
Figure 10.
Configurations of the fisheye lens system and sample with the fisheye lens system (a) located 2 cm directly above the target and separated from the target diagonally by (b) 4 cm, (c) 6 cm, and (d) 8 cm. (e) Peak-to-peak echo amplitudes, (f) center frequencies, (g) pulse widths, and (h) −6 dB bandwidths vs. distance from the lens to the target. The results obtained using the red, green, and blue lights are represented by the dashed-dotted, dotted, and solid curves, respectively.

