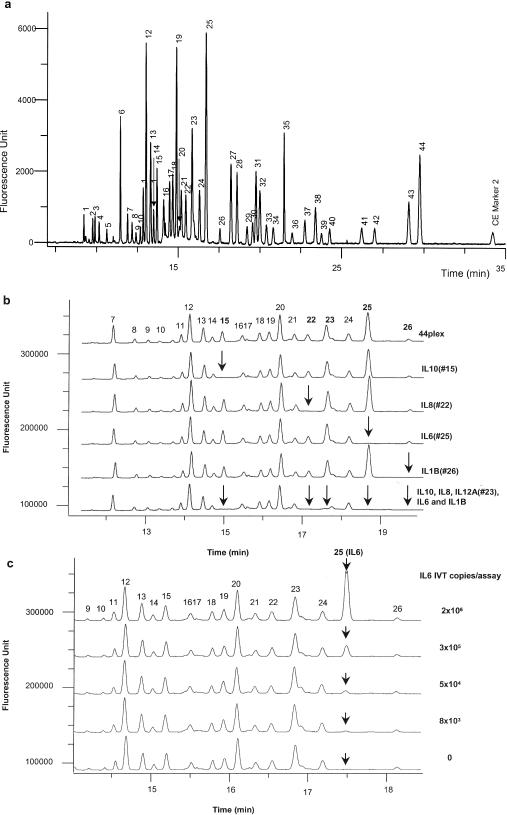
Figure 2.

(a) Separation of 44 eTag reporters generated from a single eTag mRNA assay of 44 different in vitro transcription targets at a concentration of 1 × 10⁶ copies per assay. The 44 analytes (based on the order of the electrophoretic mobility) are: CYP1A2 (1), PPIA (2), CYP2B6 (3), CYP2C9 (4), FOS (5), MYC (6), IL1A (7), MMP1 (8), GCS (9), TGFB1 (10), CYP1A1 (11), PPARG (12), C3 (13), TNFAIP3 (14), IL10 (15), GRP78 (16), IL18 (17), SOD (18), VEGFC (19), CCNA1 (20), BCL2 (21), IL8 (22), IL12A (23), JUN (24), IL6 (25), IL1B (26), GMCSF (27), IL12B (28), TNF (29), CCNE1 (30), CYP2C19 (31), GAPD (32), RAD51 (33), CYP3A5 (34), CYP3A4 (35), CCNB1 (36), G6PD (37), VEGF1 (38), ATF3 (39), CREB1 (40), UBQ (41), BAX (42), CDK1 (43) and CDK6 (44). CE marker 2 is an electrophoresis reference control. (b) Probe specificity in a 44-plex assay. The top electropherogram shows signals generated when all the analyte targets (IVTs) were present in the concentration of 1 × 10⁶ copies per assay. As specific target withdrawn from the target mixtures, the corresponding signal was absent (in arrows) as shown in the examples of IL10 (15), IL8 (22), IL6 (25), IL1B (26) and IL12A (23). (c) Signal linearity in the 44-plex assay. The specific signal for IL6 (in arrow) was linearly correlated to the concentration of analyte IL6 (25) tested in the range of 2 × 10⁶ to 8 × 10³ copies per assay (R2 = 0.998, the plot is not shown).
