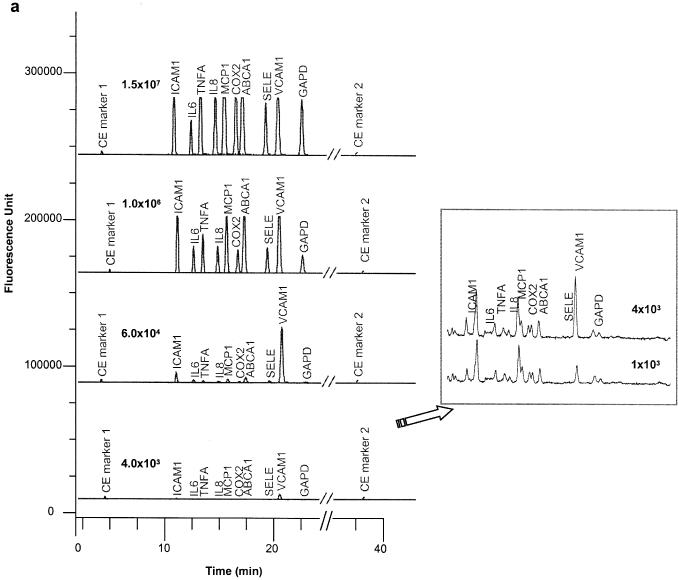
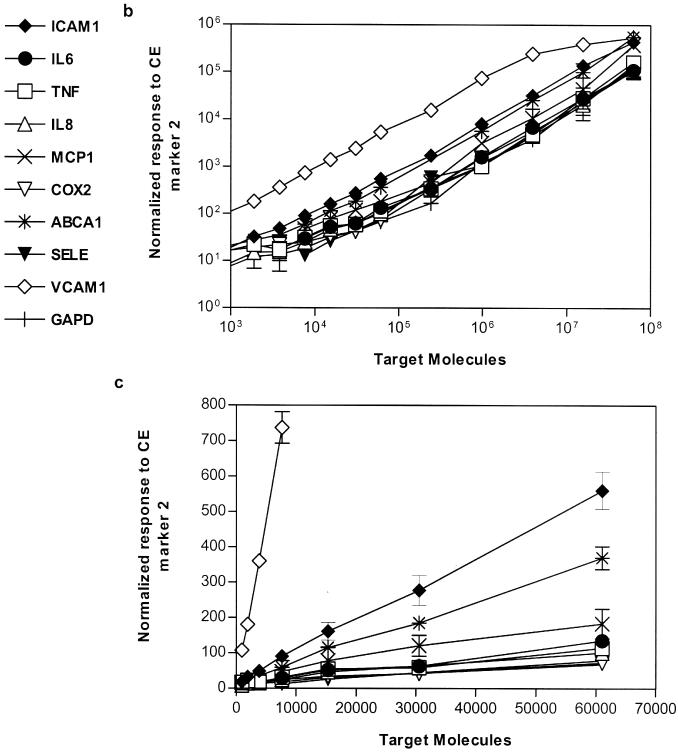
Figure 3.


Assay sensitivity and linearity. (a) Electropherograms of 10-plex eTag mRNA assays run on ABI PRISM® 3100 Genetic Analyzer. CE marker 1 and 2 are the electrophoresis reference controls. An expanded view for low concentrations of target at 4 × 10³ and 1 × 10³ molecules per reaction is shown in the insert. (b) Average RPHs normalized to CE marker 2 in triplicates as a function of target concentration was plotted in double logarithm scale ranging from 1 × 10³ to 6.25 × 10⁷. (c) An expanded view for lower target concentration. A linear regression was performed on target concentration response curve for each gene. The LOQ and the coefficient of correlation for signal linearity curves are summarized in Table 1.
