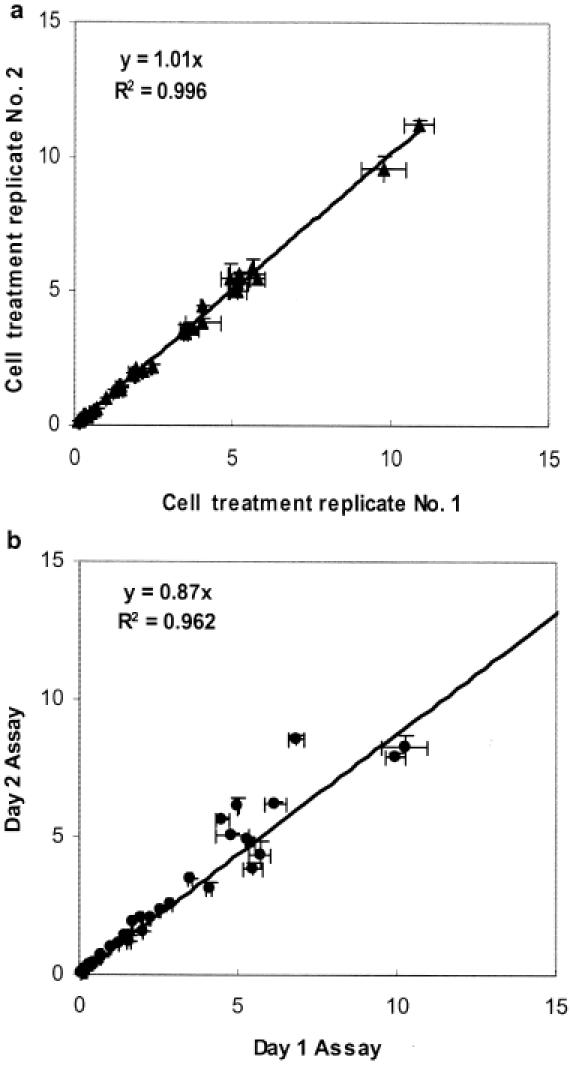
Figure 4.

Assay precision. (a) Well-to-well variability for overall assay performance. In two identical experiments, HUVECs were treated with eight doses of IL1β and the assays were performed in triplicates. The expression of the 10 endogenous transcripts from each treatment experiment was compared. The average normalized response to GAPD was calculated and plotted against that of the counterparts. The standard deviations of the triplicate measurement were presented as the X and Y error bars. (b) Day-to-day variability. On two different days, the assays were performed in triplicate on the same sample. The standard deviations of the triplicate measurement are presented as the X and Y error bars.
