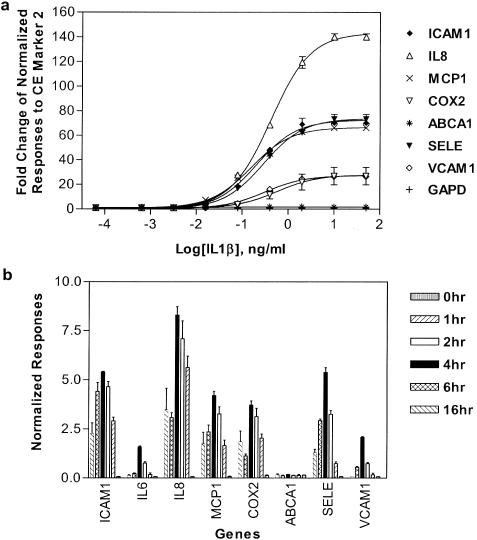
Figure 5.

The dose–response and time course on mRNA expression upon IL1β treatment on HUVEC. (a) Dose–response curve. HUVEC received nine doses of IL1β from 50 ng/ml to 0.64 pg/ml (1:5 serial dilutions) for 4 h. A 10-plex eTag mRNA assay was performed in triplicates. The gene expression fold-change was calculated by taking the ratio of normalized response (to CE marker 2) of treatment with respect to that of the untreated controls. The sigmoidal dose–response curve was fitted for eight genes only (as TNF and IL6 which was not expressed in untreated samples) using the following equation: Y = Ylower plateau(Yupper plateau − Y1lower plateau)/[1 + 10(logEC50−X)*Slope], where Ylower plateau and Yupper plateau are the fold changes measured at two plateaus of the curve, and the slope is variable slope at the response region (GraphPad Prism 3.03). (b) The compound treatment time course. HUVECs were treated with 2 ng/ml of IL1β for 1, 2, 4, 6 and 16 h. The normalized responses (to GAPD) were plotted as a function of treatment time. The error bars represent the standard deviation of the average relative normalized responses to GAPD.
