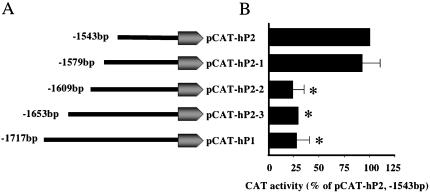
Figure 2.
Identification of a glucose responsive repressor element in hAT1R gene promoter. To identify further the repressor element additional hAT1R promoter CAT constructs were generated within the –1543 to –1717-bp region. (A) Schematic representation of the pCAT reporter expression vector containing serially deleted 5′ promoter region of the hAT1R gene. For the functional analysis of these constructs, hPTECs were transiently transfected and CAT activity measured. (B) Solid bars represent the CAT activity for each serially deleted hAT1R promoter fragment in hPTECs. Data are expressed as CAT activity normalized to β-galactosidase activity for each construct. The results represent the mean ± SEM of three separate experiments. *p <0.05 versus pCAT-hP2 (-1543-base pair) fragment.

